
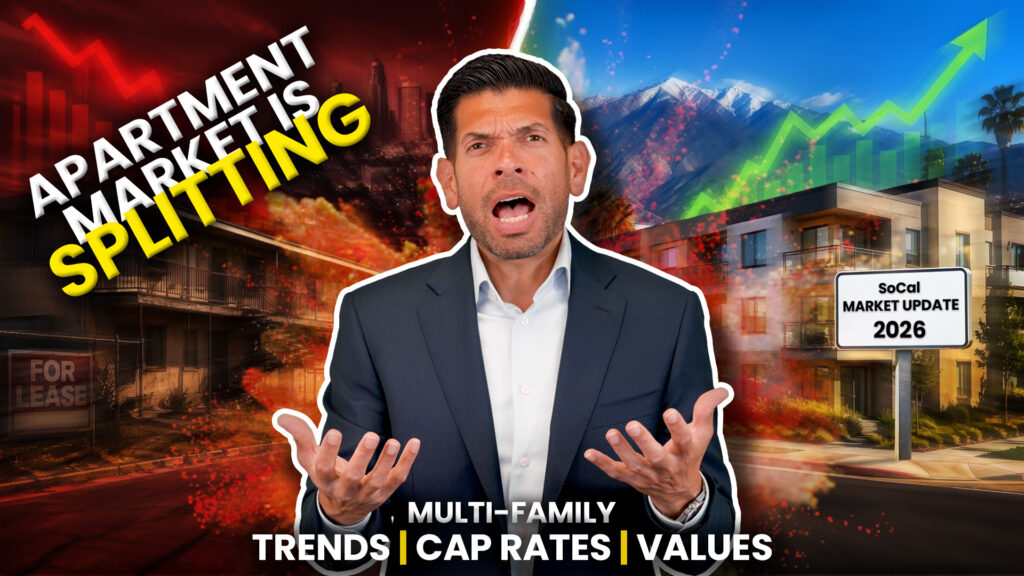

Your property value is dropping because the market is not stabilizing. It is separating. When your rental income stays flat while operating expenses and CAP RATES rise, your Net Operating Income (NOI) shrinks. Buyers no longer pay a premium for future appreciation. They strictly underwrite the cash you collect today, meaning they heavily penalize stagnant or mismanaged buildings.
Many owners assume the market is simply experiencing a temporary pause. The reality is that you are no longer selling into a rising market. You are selling into a filtered market. If your multi-family building is producing the exact same income it did a year ago, you are actively falling behind. To protect your equity, you must understand exactly how buyers are evaluating deals in your specific neighborhood right now.
The Local Corridor Math & Market Implications
You must evaluate your multi-family property against the data from the exact geographical corridor you own in, rather than relying on broad national headlines. Buyers are no longer paying for potential. They are strictly underwriting the cash you collect right now.
Here is exactly how buyers are valuing properties across Southern California, and what those numbers mean for your next move:
East San Gabriel Valley (Azusa, Baldwin Park, Covina, El Monte, Glendora, La Verne, Monrovia, South El Monte, West Covina)
- Price Per Unit: $277,000 | CAP RATE: 5.35% | GRM: 12.89
- The Implication: This is a filtered market. Prices are rising alongside CAP RATES, meaning buyers are strictly paying for yield on highly desirable properties.
- Seller Strategy: You are not selling into a rising market. Buyers heavily penalize mismanaged assets. You will only get premium pricing if you have already done the hard operational work.
- Buyer Strategy: This is where opportunity shows up. You win by identifying mismanaged assets and driving Net Operating Income (NOI) today, rather than hoping for appreciation tomorrow.
West San Gabriel Valley (Rosemead, San Gabriel, Temple City)
- Price Per Unit: $326,000 | CAP RATE: 5.17% | GRM: 15.0
- The Implication: This is a capital preservation market. It offers a strong tenant base and lower volatility, but collected income is not growing fast enough to justify aggressive pricing.
- Seller Strategy: You will not get punished by buyers here, but you will not get a premium for doing nothing. To maximize value, you must push rents and tighten expenses before listing.
- Buyer Strategy: You are buying stability, not immediate upside. Expect lower risk but lower immediate returns for a strong long-term hold.
East Los Angeles (Boyle Heights, East LA, El Sereno)
- Price Per Unit: $195,000 | CAP RATE: 5.23% | GRM: 11.14
- The Implication: This is a pure cash flow market heavily pressured by strict rent control and operational challenges.
- Seller Strategy: You are selling income, not appreciation. Your actual rent roll and income stability matter far more than future upside potential.
- Buyer Strategy: You cannot win by timing the market here. You win by running a tight operation, managing tenants effectively, and aggressively controlling your expenses.
710 and 91 Corridors (Bell, Bell Gardens, Commerce, Cudahy, Huntington Park, Maywood, South Gate)
- Price Per Unit: $199,000 | CAP RATE: 5.69% | GRM: 11.77
- The Implication: This is a true repricing market with heavy rent control exposure. Buyers are not stretching their budgets to take on risk.
- Seller Strategy: The market is not coming back to save you in the short term. You must price correctly now, or sit and absorb the rising regulatory costs and risks.
- Buyer Strategy: This is where you find motivated sellers and negotiate strong terms. Deals are created here every day for investors with the stomach for higher regulation.
605 Corridor (Bellflower, Downey, La Puente, Montebello, Norwalk, Paramount, Pico Rivera, Whittier)
- Price Per Unit: $261,000 | CAP RATE: 5.35% | GRM: 12.4
- The Implication: This market offers reliability and stability compared to other regions.
- Seller Strategy: If you stayed on top of your rental increases, your equity is protected. If your income is flat, your equity is quietly eroding as CAP RATES rise.
- Buyer Strategy: You can count on stability and a higher yield than you have seen historically in this area.
Inland Empire West & East (Chino, Claremont, Montclair, Ontario, Pomona, Rancho Cucamonga, Upland)
- Price Per Unit: $222,000 | CAP RATE: 6.00% | GRM: 12.5
- The Implication: This market is in a normalization phase, unwinding massive previous gains as rent growth slows and buyers actively reprice risk.
- Seller Strategy: You missed the peak, but you have not missed the window. You must be highly realistic on pricing and focus heavily on strong presentation.
- Buyer Strategy: Buy based entirely on today’s fundamentals, not past appreciation trends.
Whether your property sits in a highly regulated repricing market, a pure cash flow market, or a capital preservation corridor, you must decide your next step based on today’s math. Your options are to improve your operations and hold, trade into a better-performing multi-family asset, or plan a clean exit.
Do not guess what buyers will pay. Email me your rent roll and current debt terms. I will model “keep vs. trade up” in real numbers so you can see exactly where your equity stands today before the market forces your hand.
📞 (626) 427-0786 | 📧 email@theapartmentdealer.com
Educational only; not legal, financial, or tax advice. Consult your advisors.
FAQs
What does a “filtered” real estate market mean?
A filtered market means that multi-family properties no longer sell for a premium simply because they exist. Buyers actively filter out mismanaged properties, properties with deferred maintenance, or buildings with flat rent rolls, and they severely penalize those assets in their offer price.
What is a repricing market?
A repricing market occurs when rising operating costs, strict rent control, and higher interest rates suppress property values. Buyers demand higher CAP RATES to offset their increased risk, meaning sellers must align their asking prices with today’s math rather than past appreciation to successfully close a deal.
What is a CAP RATE?
The CAP RATE, or capitalization rate, is the expected annual rate of return on an investment property. Buyers use it to value your building by dividing your Net Operating Income (NOI) by the market CAP RATE. When CAP RATES go up, property values go down unless your income grows fast enough to offset the difference.
What is GRM?
GRM stands for Gross Rent Multiplier. It is calculated by dividing the purchase price of the multi-family property by its annual gross scheduled rent. A lower GRM generally means a buyer is paying less per dollar of rent, which is often better for day-one cash flow.
Why is my multi-family property losing value if it is completely full?
If your building is full but producing the exact same income it did a year ago, your Net Operating Income is shrinking because your operating expenses, insurance, and taxes are higher today. Buyers underwrite the actual cash you collect right now, meaning flat rental income directly erases your equity.
Related Market Updates & Resources
If you want to dig deeper into the specific strategies mentioned above, these resources from our private video library and YouTube channel break down the exact math and legal rules you need to know today:
Watch this market update to see how today’s rents, prices, and rent rules across Southern California are really affecting multi-family owners.
If you are unsure of your next move, this session shows you how to sort each property into a keep, trade, or exit bucket.
3) Plan Your Exit & Preserve Wealth
If the math tells you it is time to sell, you must protect your equity from taxes.
Are your loan terms putting your Net Operating Income at risk?
▶️ Click Here To Subscribe To The Apartment Dealer YouTube Channel
Subscribe to our channel to get weekly insights, expert interviews, and market updates built specifically for Southern California multi-family investors.